Density Altitude
Density altitude is the altitude your helicopter thinks it's at, given the actual density of the air around it. Hot, high, and humid all reduce air density, which means the rotor produces less lift for the same blade pitch and the engine produces less power. A helicopter that hovers fine at sea level on a cool morning may not hover at all at 8,000 ft on a hot afternoon — even though the field elevation hasn't changed.
Also called: DA, "the high-and-hot problem"
What density altitude is
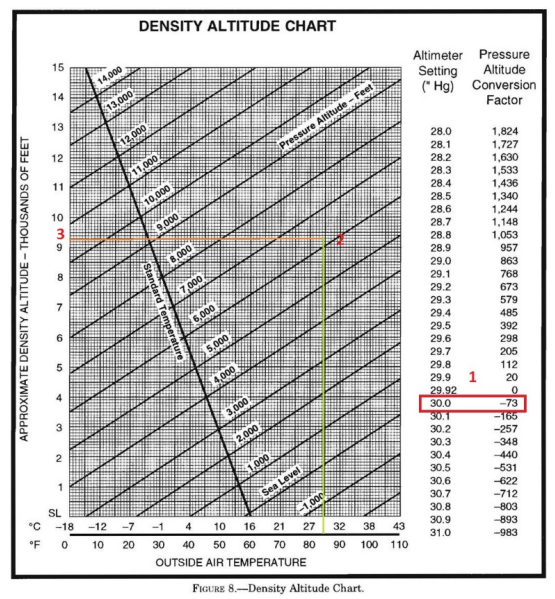
Standard atmosphere is defined as 29.92" Hg pressure and 15°C at sea level, with temperature decreasing 2°C per 1,000 ft (the standard lapse rate). Pressure altitude is your indicated altitude when the altimeter is set to 29.92. Density altitude is pressure altitude corrected for non-standard temperature.
Quick mental math: density altitude rises about 120 ft for every degree Celsius above standard. A 5,000 ft pressure-altitude airport on a day that's 20°C above standard has a DA of around 7,400 ft. That's the altitude your helicopter performance is actually being judged against — not the field elevation on the airport diagram.
The formula in the AIM and most ground school texts: DA = PA + (120 × ISA deviation in °C). Close enough for back-of-the-envelope work; for actual performance planning, use the POH charts.
Why DA matters more for helicopters
Fixed-wing pilots care about DA because takeoff and climb performance suffer. Helicopter pilots care more, because:
- Hover performance is a hard requirement — you can't "use more runway" to make up for it. Either the rotor produces enough lift to hover at your gross weight at this DA, or it doesn't.
- The tail rotor is also affected — at high DA the tail rotor produces less anti-torque thrust, which is why LTE risk rises.
- Engine power output drops — turbine engines are derated at high DA; piston engines lose power roughly proportional to air density.
- Translational lift onset doesn't change much — ETL still kicks in at the same airspeed, but the absolute lift produced is lower because the air is thinner.
Reading POH performance charts
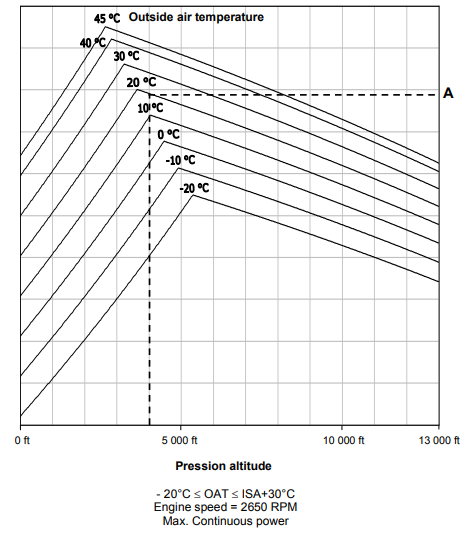
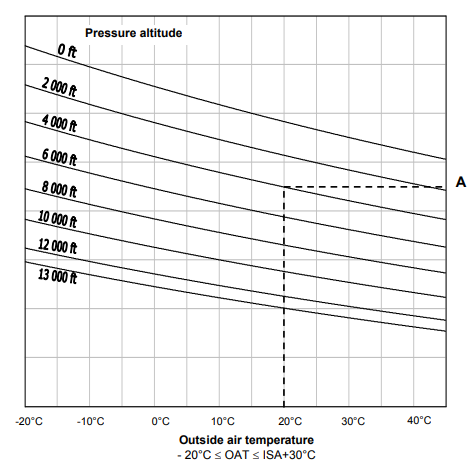
Every helicopter POH (R22, R44, B206, etc.) includes hover performance charts. They typically plot:
- Hover IGE chart — maximum gross weight at which you can hover in ground effect, as a function of pressure altitude and OAT.
- Hover OGE chart — same, but out of ground effect. Lower numbers — OGE always demands more.
The discipline: before a high-DA flight, look up your hover OGE ceiling at expected gross weight and DA. If you can't hover OGE at the destination DA, you can't safely operate there. "Marginal" doesn't mean "slowly" — it means "no margin for engine sag, gust, or pilot error."
Operational signs of high DA
If you're not paying attention to the chart, the helicopter will tell you:
- Higher-than-normal collective in a hover
- Rotor RPM that wants to droop with collective application
- Very little control margin on pedals (especially left, on a US helicopter)
- Slow climb-out, mushy response to cyclic
- The aircraft "settles" rather than climbs from a hover
Any of those at takeoff is a stop signal. Land, recompute, reduce weight (less fuel? a passenger out?) or wait for cooler/lower-DA conditions.
The triple threat
The pneumonic some students learn for what makes DA worse: HHH — High elevation, High temperature, High humidity. All three independently reduce air density. The combination is multiplicative for safety risk:
- High elevation — less atmospheric pressure overhead, fewer molecules per cubic foot.
- High temperature — molecules move farther apart at higher temperatures.
- High humidity — water vapor displaces denser nitrogen and oxygen molecules. Effect is small but real.
A 6,000 ft mountain helipad on a 35°C day with 80% humidity is the textbook setup for an under-power departure. The forecast doesn't have to be exotic — most "high DA" surprises happen on summer afternoons at airports the pilot has used dozens of times in winter.